Local AI vs. API: Which Is Cheaper? Real Cost Breakdown
Compare local AI vs. API costs with real break-even math: GPU amortization, electricity, ops labor and per-token pricing, from 0.3 to 69 months.

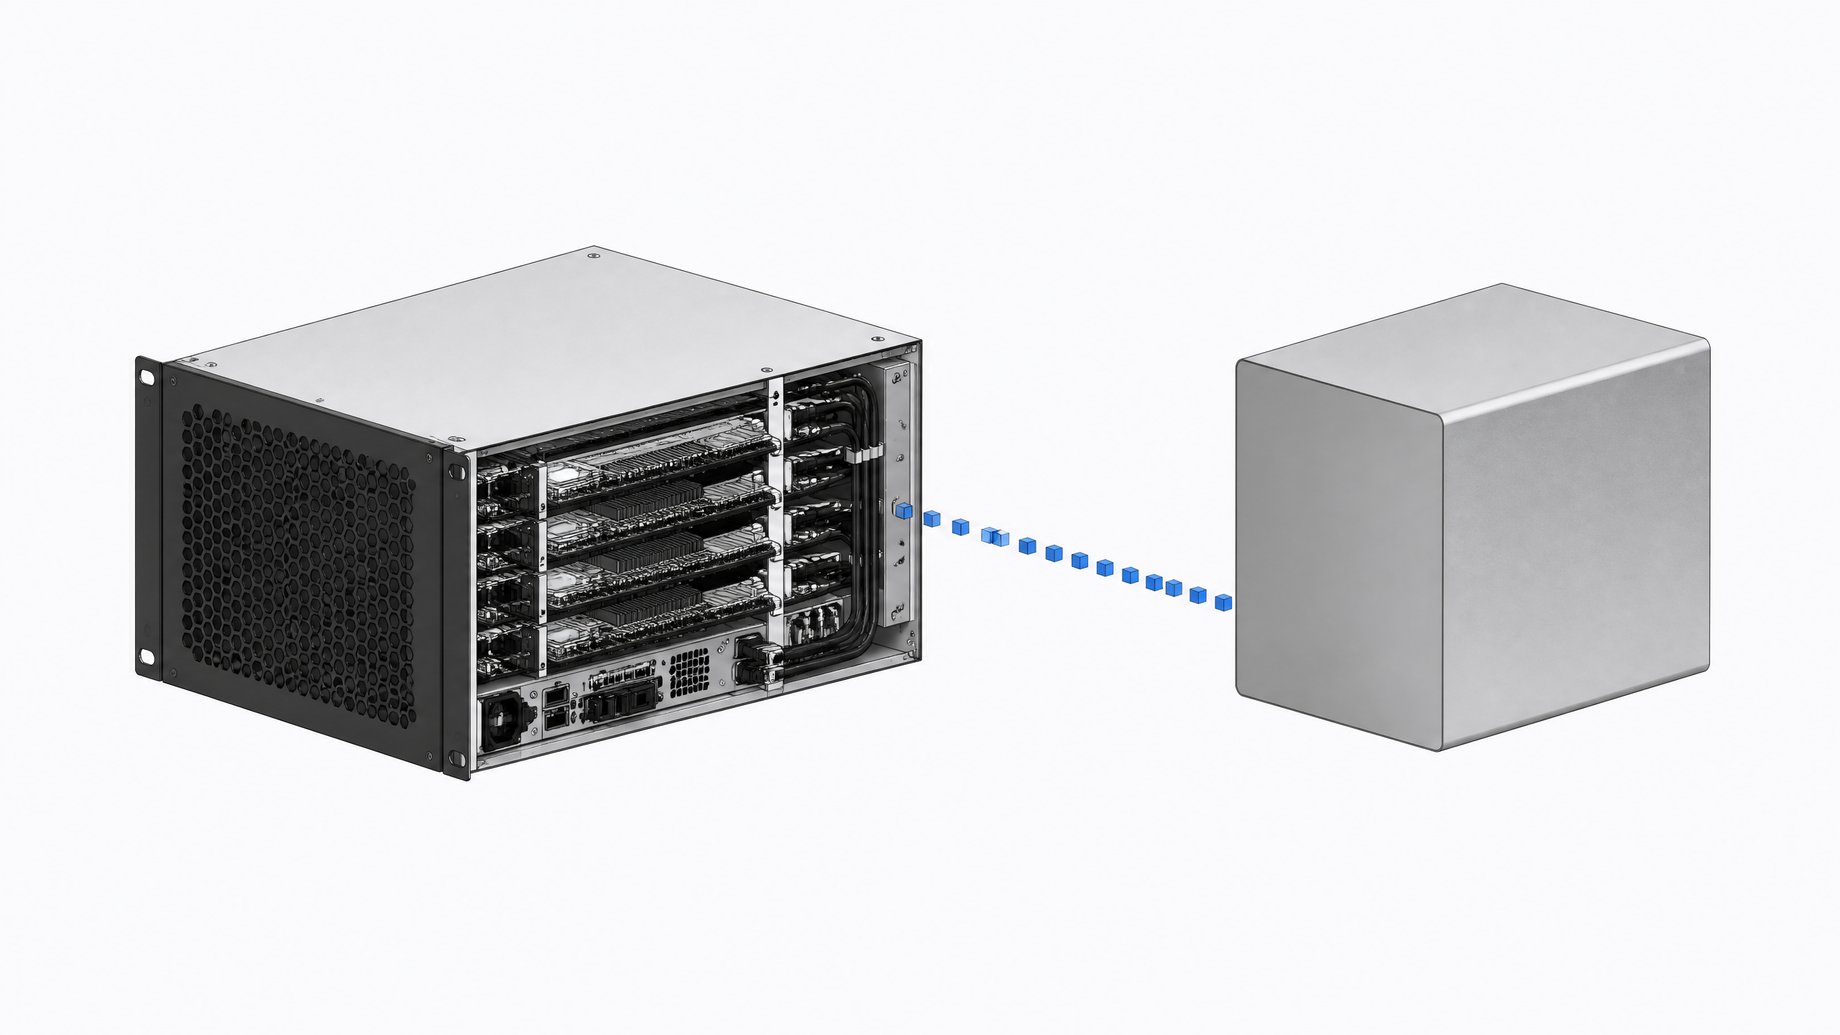
Is local AI cheaper than an API, or does renting cost less?
Running AI locally costs more than renting it from an API, until it doesn't. The break-even point turns on four numbers: token volume, electricity rate, hardware choice, and how much ops labor you're willing to pay for. It's solvable, not a philosophy.
Most of what you hear on this topic is dogma dressed up as advice. "Local AI is free once you buy the GPU" ignores depreciation and power draw. "APIs are always cheaper at scale" ignores that a fintech company just cut its monthly AI bill from $47,000 to $8,000 by moving workloads in-house. Both claims are true somewhere and false almost everywhere else. The real question is where your volume, hardware budget, and team capacity put you on the curve. A peer-reviewed cost-benefit study out of Carnegie Mellon modeled 54 deployment scenarios, nine open-source models against six commercial APIs, and found break-even periods ranging from 0.3 months to 69.3 months. That spread is the entire argument. There's no single answer, only a formula you plug your own numbers into.
TL;DR
- The break-even point turns on four numbers: token volume, electricity rate, hardware choice, and ops labor.
- A Carnegie Mellon study of 54 scenarios found break-even periods from 0.3 to 69.3 months, so there is no single answer.
- Small models on consumer GPUs tend to break even within three months against premium API pricing, and sometimes in just 0.3 months.
- Hidden self-hosting costs like ops labor and maintenance can reach $54,000 a year at production scale.
- Workloads under roughly 2 million tokens a day almost always favor renting from an API.
- Organizations with high shadow AI usage see average breach costs $670,000 higher than those with low or no exposure.
How Much Do API Tokens Actually Cost?
Sticker price per million tokens is the easy part. OpenAI's GPT-4.1 runs about $6.90 per million tokens at light usage, Anthropic closer to $9.86, and the cheapest hosted open-weight APIs go as low as $1.97. That's nearly a 5x spread, and it's before you account for the blended input-to-output ratio most workloads actually produce: output tokens price higher than input tokens, and chat-heavy applications skew output-heavy.
The quoted rate isn't the real rate, either. Retries on malformed JSON, egress charges from moving data across clouds, cache misses on prompts you assumed would be cached: none of it shows up on a vendor's pricing page, and all of it shows up on your invoice. To separate list price from effective price in your own usage pattern, the manual math in the break-even analysis for quantized local models walks through it line by line.
How Much Does It Cost to Own the Hardware?
The local side of the ledger has three real line items, and almost every "local AI is free" argument skips at least one of them.
- Hardware amortization. A $3,350 RTX 5090 build depreciates straight-line at roughly $93 per month over 36 months. A single enterprise H200 GPU, at roughly $30,000, depreciates at about $833 per month.
- Electricity. US commercial electricity averaged 14.53 cents per kWh as of mid-2026. EU rates run $0.25 to $0.30 per kWh, roughly double, which alone pushes a European break-even point 40 to 60 percent higher in required daily token volume.
- Per-query energy, which is smaller than you'd guess. Optimized frontier-scale inference measured in production runs a median of 0.31 Wh per query, and Google's own disclosed figure for a Gemini Apps text prompt is 0.24 Wh. Electricity is a real cost, but it's rarely the deciding one. Hardware amortization and labor dominate the total.
Put those pieces together and a single RTX 4090 running an 8B model at 500,000 tokens a day costs about $59 a month: roughly $50 in amortized hardware plus $8.60 in power. That's already more than a budget-tier API running the same volume, around $6 a month. Local only starts winning against flagship-tier API pricing, and even then it takes about 20 months to break even.
What Do Ops Labor and Maintenance Cost, the Line Item Nobody Models?
This is the line item that kills most "local is cheaper" spreadsheets. Self-hosted inference needs someone to patch drivers, manage CUDA versions, monitor GPU health, and handle the occasional hardware failure. That labor scales with usage: roughly 2 to 4 hours a month at light usage, 8 to 15 hours at medium usage, and 30 to 60 hours a month at heavy production scale.
At an assumed $75 an hour DevOps rate, that's about $1,800 a year at the light end and $18,000 to $54,000 a year once you're at scale. Most back-of-napkin local-vs-API comparisons quietly treat this number as zero, because the engineer doing the math is already on payroll and the hours feel "free." They aren't. They're hours that engineer isn't spending on something else, and as usage grows, so does the maintenance tax.
What Is the Break-Even Formula and Where Does It Actually Land?
The formula itself is simple:
Break-even (months) = Hardware cost ÷ (Monthly API cost − Monthly local cost, including electricity and labor)
Run that formula across model sizes and the picture splits into three tiers:
- Small models (sub-30B parameters, roughly a $2,000 consumer GPU) tend to break even within three months against premium API pricing, sometimes as fast as 0.3 months in the most favorable scenario modeled.
- Medium models (dual-A100 setups, $15,000 to $30,000 in hardware) land in the 6-to-24-month range.
- Large models (multi-GPU clusters, $40,000 to $240,000) take 2 to 9 years to pay off, depending on which commercial API you're comparing against.
Independent calculations converge on a rough daily-volume threshold too. Several sources put the crossover for commodity open models against mid-tier commercial pricing somewhere between 2 million and 10 to 20 million tokens a day. On a monthly basis, dedicated GPU hosting for a 70B-class model crosses over against GPT-4o's blended $4.38 per million tokens around 100 million tokens a month, below which the fixed GPU cost sits underutilized. It's the same utilization math that decides whether you buy GPUs or rent cloud AI for any workload, not just LLM inference. Push a single RTX 4090 to 2 million tokens a day and the break-even against mid-tier API pricing stretches to 44 months, longer than the GPU's practical three-year life. Scale all the way up to a 50-million-token-a-day enterprise deployment over 36 months, and the effective local rate drops to $7.15 per million tokens: that beats Anthropic's $9.86 and roughly matches OpenAI's $6.90, but still loses to the cheapest hosted open-weight APIs at $1.97. The full 54-scenario model behind these numbers is laid out in the CMU-affiliated cost-benefit study's companion breakdown.
| Upfront Cost | Cost at High Volume | Ops Labor Burden | Compliance/Latency Control | Typical Break-Even | |
|---|---|---|---|---|---|
| API (Rent)light and medium, unpredictable usage | $0 | High | Low | Low | N/A — pay-as-you-go |
| Local (Own)high, steady volume with in-house MLOps | $2,000–$240,000 | Low | High | High | 3 to 108+ months, depending on scale |
| RecommendedHybridmost organizations: predictable load local, long tail on API | Moderate | Medium | Medium | — | Varies by workload split |
Why Does the Threshold Keep Moving?
None of these numbers are fixed. Three variables move the break-even point by double digits in either direction:
- Electricity rate. The same hardware that pays off in 18 months in a low-cost US state can take 25 to 30 months in a high-cost EU market, purely because power is roughly double the price.
- GPU prices. Consumer GPU prices have been volatile enough that a model built on $2,000 hardware assumptions can look very different six months later.
- API price cuts. Every major vendor has cut per-token pricing multiple times in the past two years. A break-even calculation done against today's API price is already stale against tomorrow's.
This is why the honest answer to "which is cheaper" is "run your own numbers quarterly," not a fixed number. Anyone selling you a crossover point without asking about your electricity rate and your usage curve is skipping a variable that materially changes the answer.
When Does the Math Not Matter: Compliance, Latency, and Shadow AI Risk?
Sometimes the spreadsheet isn't the deciding factor. Regulated industries with data residency requirements, HIPAA constraints, or strict latency budgets often choose local deployment regardless of where the break-even point sits, because the alternative isn't a cost tradeoff. It's a compliance failure waiting to happen.
There's an inverse risk worth naming directly: employees are already making this build-vs-rent decision on their own, without waiting for a TCO analysis. Organizations with high shadow AI usage, including staff running unsanctioned local models on company hardware, see average breach costs $670,000 higher than organizations with low or no shadow AI exposure, and only 37 percent of organizations have any policy to even detect it. The decision to run AI locally isn't only an IT-sanctioned calculation anymore. It's already happening informally inside a lot of companies that haven't done the math at all.
What Is the Hybrid Verdict, and How Do You Decide?
Enterprise AI spend hit $37 billion in 2025, up 3.2x from the prior year, with more than half going to AI applications rather than infrastructure. Most organizations are still renting, and for good reason: light and medium usage almost always favors the API. A $35.37 effective cost per million tokens for light-tier local deployment loses badly to a $6.90 API rate.
A practical framework looks like this:
- Under roughly 2 million tokens a day, rent. The hardware sits underutilized and the ops labor isn't justified by the volume.
- Between 2 million and 100 million tokens a day, model it against your specific API tier. This is the zone where GPU choice, electricity rate, and labor cost decide the outcome, not general advice.
- Above that, with steady, predictable load, local usually wins, especially if you already have MLOps capacity on staff. The fintech example that cut spend by 83 percent did it with an existing team and a steady workload, not a one-off migration.
- Regardless of volume, compliance or latency requirements override the math. If you can't legally send the data out, the break-even calculation is moot.
Most teams land somewhere in the middle: route high-volume, predictable, non-sensitive workloads to owned hardware, and keep the long tail of unpredictable or compliance-sensitive traffic on the API. Before you commit to a GPU purchase, check where your own token spend actually concentrates. The guide to self-hosting your company's AI stack covers the operational side of making that split work once you've picked your threshold. The math is knowable. It's just rarely the same math twice.
Frequently Asked Questions
At what token volume does local AI become cheaper than an API?
There's no single number, but independent analyses converge on a rough range of 2 million to 10-20 million tokens per day for commodity open models against mid-tier commercial API pricing, and roughly 100 million tokens per month for dedicated GPU hosting against GPT-4o's blended rate. Your exact crossover depends on GPU choice, electricity rate, and which API tier you're comparing against.
Does the local-vs-API cost comparison include electricity?
It should, but electricity is usually a smaller factor than people expect. US commercial power averages about 14.5 cents per kWh, and measured per-query energy use at production scale is well under 1 Wh. Hardware depreciation and ops labor dominate the total cost far more than power draw does.
What is the biggest hidden cost in self-hosting an LLM?
Ops and maintenance labor. Monthly DevOps hours for self-hosted inference scale from 2-4 hours at light usage to 30-60 hours at heavy usage, which at a $75/hour rate adds anywhere from $1,800 to over $50,000 a year, a cost most 'local is free' comparisons leave out entirely.
Is renting an API always cheaper at low usage?
Generally yes. At light usage, around 500,000 tokens a day, local self-hosting on consumer hardware runs an effective $35.37 per million tokens over 12 months, far above budget and even flagship API pricing. Local economics only improve as volume climbs toward enterprise scale.
Do compliance requirements change the local-vs-API decision?
Yes, and they can override the cost math entirely. Data residency rules, HIPAA, and strict latency requirements often push organizations toward local deployment regardless of break-even timing, because the alternative is a compliance risk rather than a cost tradeoff.
How we source, write, and correct our articles. Editorial standards