How to Analyze NPS and CSAT Survey Comments with AI
Step-by-step: clean your NPS and CSAT comments, have AI sort them into themes, check the results, and report what to fix. Includes copy-paste prompts.

For Customer Success, Customer Support and Executives
How do you analyze NPS comments with AI?
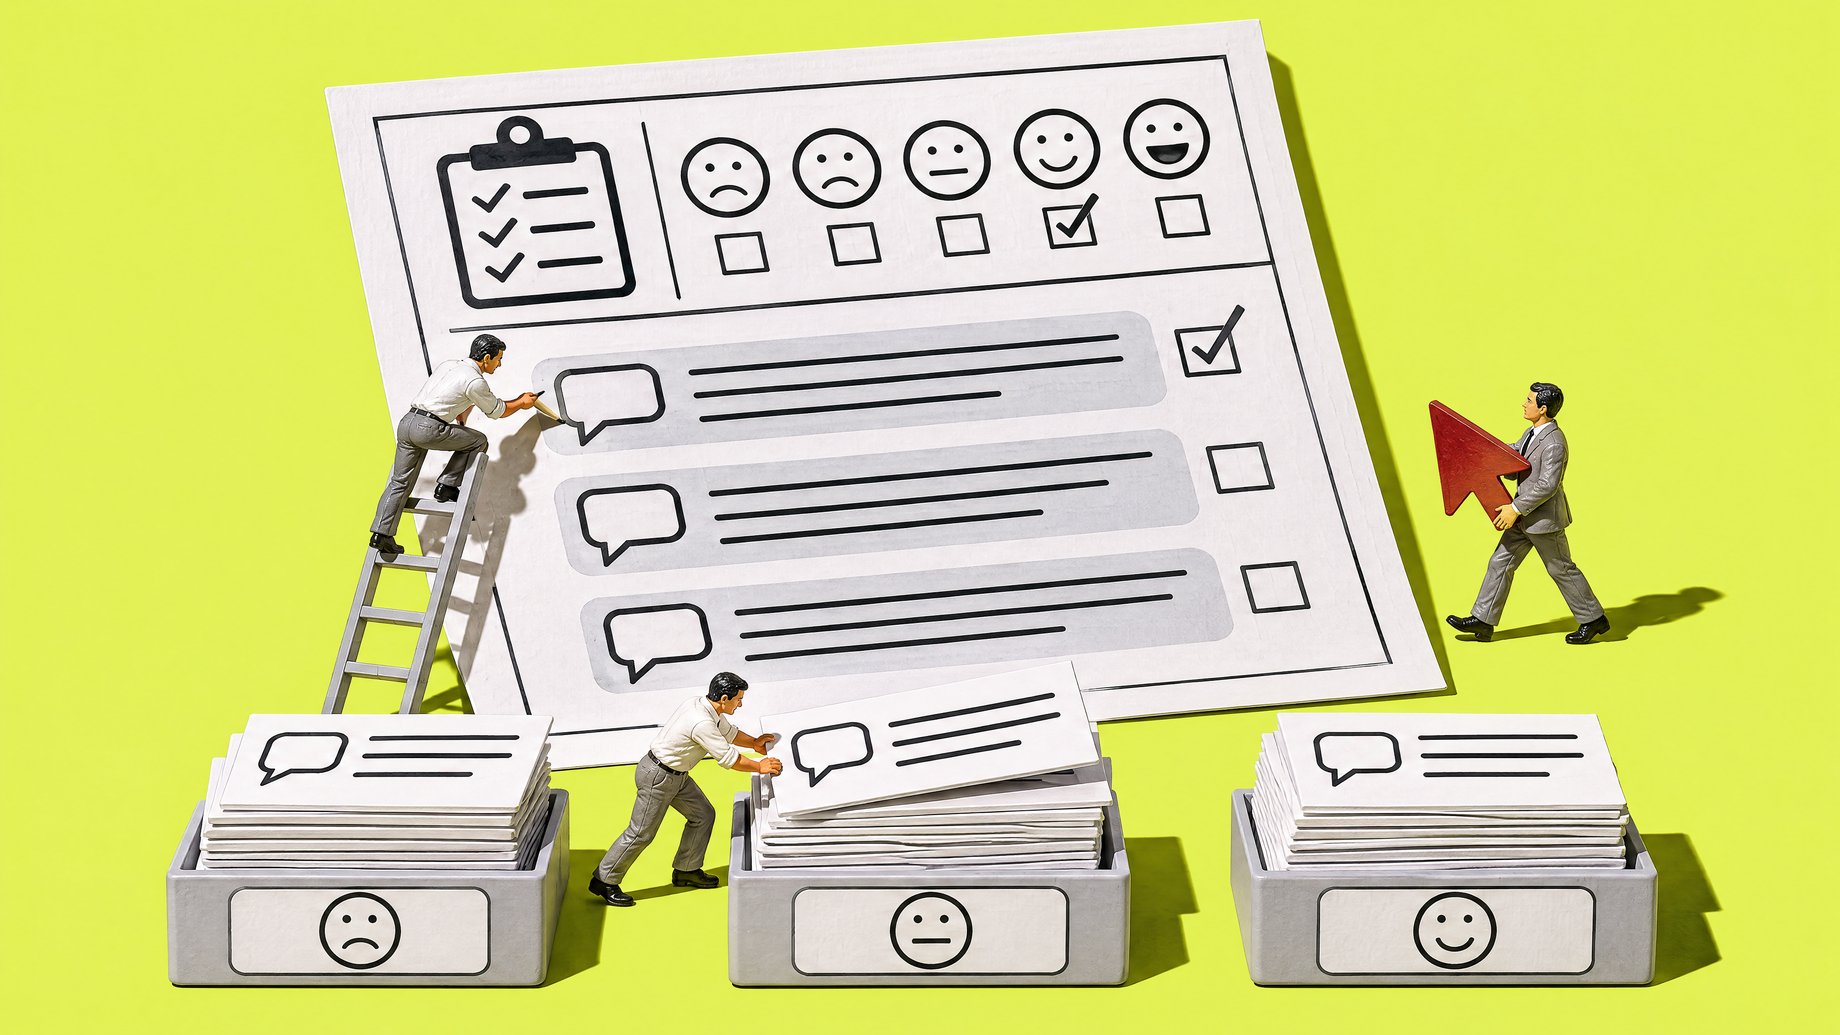
Export your comments with the score, date and customer segment. Remove personal details. Have AI read a sample and propose a short list of themes (8 to 15). Lock that list with definitions, then have AI tag every comment against it in batches. Count the tags in a spreadsheet, not in the chat. Spot-check about 50 tags by hand, then report each theme's size, trend and one action. The same method works for CSAT comments.
The reason to do this is simple. The score tells you how many people are unhappy. The comments tell you why. Most teams collect thousands of comments and read a few dozen, so the "why" gets lost. AI is good at the reading and sorting. You stay responsible for the definitions, the counts and the conclusions.
TL;DR
- Let AI propose themes, then lock them. A fixed list with definitions keeps tagging consistent from one batch to the next and from one quarter to the next.
- Do the counting in a spreadsheet. AI chat tools are good at reading and unreliable at tallying large sets, so use them for tags and use a pivot table for numbers.
- Read 50 comments yourself first and check 50 tags afterward. This is the cheapest way to catch a bad theme list or a tagging habit that is slightly off.
- Split every theme by score band and segment. A theme that appears in 9% of comments matters more if it makes up 22% of your detractors.
- Verify every quote before it goes in a slide. Search the original file for the exact text.
- Strip names, emails and account numbers first, and use only AI tools your company has approved for customer data.
What do you need before you start?
You need four things.
- A comment export. One row per response, with at least these columns: response ID, date, score, customer segment (plan, region, or account tier), and the comment text. Your survey tool, help desk or CRM can export this as a CSV.
- A question. "What are customers saying?" is too broad. Better: "What is driving detractors this quarter?" or "Why did CSAT drop on chat support in March?" A narrow question gives you a narrower, more useful theme list.
- An approved AI tool. Customer comments can contain names, emails, order numbers and sometimes sensitive details. Check your company's policy on which AI tools may receive customer data. If you are unsure, ask your security or legal team before pasting anything.
- A spreadsheet. Excel or Google Sheets is enough.
A quick refresher on the scores, since the comments map to them. NPS asks how likely someone is to recommend you on a 0 to 10 scale. Scores of 9 to 10 are promoters, 7 to 8 are passives, and 0 to 6 are detractors. NPS is the percentage of promoters minus the percentage of detractors. CSAT usually asks about satisfaction with a specific interaction on a 1 to 5 scale, and the result is typically the share of 4s and 5s. Your comments are the explanation behind those numbers.
How do you analyze NPS and CSAT comments step by step?
1. Clean the file
- Delete rows with no comment. Keep the count, because the share of people who comment is worth reporting.
- Remove duplicates (some tools export the same response twice).
- Replace names, email addresses, phone numbers and account numbers with placeholders such as [NAME] or [EMAIL]. Find and replace handles most of it. Scan a sample for what it missed.
- Keep the response ID. You will need it to connect tags back to scores.
If your file has over a few thousand rows, split it into files of 100 to 200 comments each for tagging. Smaller batches give more careful, more consistent results.
2. Read 50 comments yourself
Sort randomly and read 50. Do not skip this. You are building a feel for the language: what customers call your product, which complaints are vague, how often one comment covers three topics. Note any theme you expect to see. This also gives you something to compare the AI's list against.
3. Ask AI to propose themes from a sample
Take a random sample of 150 to 200 comments (not the first 200 rows, which may all be from one week). Paste them in with this prompt:
You are helping me analyze customer survey comments from an NPS/CSAT survey.

Below are [150] comments. Each line has an ID, a score, and the comment.

Task:
1. Read all of them.
2. Propose a list of 8 to 15 themes that cover the main reasons customers gave. Themes should be specific enough to act on (for example "Slow response from support" rather than "Support").
3. For each theme, give: a short name, a one-sentence definition, what would NOT count, and two example comment IDs.
4. Add an "Other" theme and tell me what share of the sample it would hold.
5. Tell me if any comments are unclear, off-topic, or too short to classify.

Do not invent comments. Only use IDs that appear below.

[paste comments]
4. Lock the theme list (the codebook)
Edit the AI's proposal. Merge themes that overlap, split any that are too broad, rename anything vague. The result is your codebook. Here is an illustrative example for a software company:
| Theme | Definition | Does not include |
|---|---|---|
| Pricing and value | Cost, plans, renewals, "not worth it" | Billing errors |
| Billing errors | Wrong charges, invoice problems | General price complaints |
| Support speed | Wait times, slow replies | Quality of the answer |
| Support quality | Helpful, knowledgeable, resolved or not | Speed |
| Product bugs | Things broken, errors, crashes | Missing features |
| Missing features | Requests for things the product lacks | Bugs |
| Ease of use | Confusing, hard to learn, or easy and intuitive | Performance |
| Performance | Slow, laggy, downtime | Bugs that cause wrong results |
| Onboarding | Setup, training, getting started | Ongoing support |
| Other | Anything that fits none of the above |
Save this somewhere permanent. Next quarter you will reuse it, which is what makes trends comparable.
5. Tag every comment
Now run all the comments through, in batches, with the codebook pasted into each batch. Use this prompt:
You are tagging customer survey comments using a fixed list of themes.

THEMES (use these names exactly):
[paste your codebook table]

For each comment below, return one row with:
- ID
- Primary theme (the main reason for the score)
- Secondary theme (if the comment clearly mentions another, otherwise blank)
- Sentiment about the primary theme: Positive, Negative, Mixed, or Neutral
- Confidence: High, Medium, or Low
- Key phrase: the exact words from the comment that justify the primary theme

Rules:
- Use only the theme names above. If nothing fits, use "Other".
- Do not guess at things the comment does not say.
- If a comment is too short or unclear to classify, use "Other" with Low confidence.
- Return a table with one row per ID, in the same order as the input. Do not skip any IDs.

COMMENTS:
[paste batch]
Ask for a table that you can paste straight into a spreadsheet. After each batch, check that the number of rows returned equals the number of comments you sent. Missing rows are a common failure.
The "key phrase" column matters. It forces the AI to point at the words it used, and it makes your spot-check fast, because you can see the evidence beside each tag.
6. Spot-check 50 tags
Pick 50 tagged rows at random, covering all themes. Read the comment, then the tag. Mark each one right or wrong. If you agree with 85 to 90% or more, the tagging is usable. If not, look at where the errors cluster:
- Two themes keep getting confused. Tighten the definitions and add an example of each.
- Too many comments land in "Other." You are missing a theme. Add it and retag.
- Low-confidence rows are wrong more often. Review all of those by hand.
Fix the codebook, then re-run the affected batches.
7. Count in a spreadsheet
Paste the tags next to your original data, matching on response ID. Build a pivot table with themes in rows and these in columns:
- Count of comments
- Share of all comments
- Share within detractors (0 to 6) versus promoters (9 to 10), or within CSAT 1 to 2 versus 4 to 5
- Share by segment, such as plan, region or support channel
- Count by month or quarter, if you have more than one period
Do not ask the AI to give you these counts. Language models can read and sort well, but they can miscount across a long table. A pivot table is exact and you can audit it.
8. Pull real quotes
For each of your top themes, pick two or three quotes that show the problem clearly. Ask AI for candidates if you like, but then search your original file for the exact text. Fix or drop any quote you cannot find word for word. A fabricated or altered quote in front of an executive team is a bad mistake to make.
9. Summarize for your audience
Give the AI your pivot table results and your verified quotes, and ask it to draft the readout:
Here are the results of our NPS comment analysis for [quarter]:

[paste pivot table summary: theme, count, share overall, share among detractors, change vs last quarter]

Verified customer quotes by theme:
[paste quotes]

Write a one-page summary for [Customer Success leadership / executives] that includes:
1. The three themes that most explain detractor scores, with their share of detractor comments.
2. What improved or worsened since last quarter.
3. One suggested action per theme and a suggested owner (team, not person).
4. Two caveats about the data.

Use only the numbers and quotes I provided. Do not add figures. Keep it under 300 words.
Then read it against your pivot table. Change anything that overstates what the data shows.
What does a worked example look like?
Here are five illustrative comments (invented for this example) and how the tagging output might look.
| ID | Score | Comment | Primary theme | Sentiment | Confidence |
|---|---|---|---|---|---|
| 101 | 3 | "Waited four days for a reply about a billing issue. Still not fixed." | Support speed | Negative | High |
| 102 | 9 | "Setup was painless and the team walked us through it." | Onboarding | Positive | High |
| 103 | 6 | "Good product but the price went up again at renewal." | Pricing and value | Mixed | High |
| 104 | 10 | "Fine." | Other | Neutral | Low |
| 105 | 2 | "Reports keep timing out and your support told me to clear my cache." | Performance | Negative | Medium |
Notes on what to check. Comment 101 mentions billing and support speed, and the AI picked speed as primary. A fair call, but you might set the billing error as the secondary theme. Comment 105 has a performance problem and a support quality problem. This is why you ask for a secondary theme. Comment 104 is a 10 with no information, so you want it flagged as low confidence instead of forced into a theme.
After 400 comments, the pivot table might show that "Support speed" is 9% of all comments but 22% of detractor comments, while "Pricing and value" is 15% overall and spread evenly. That is the kind of finding that changes what you work on: the smaller theme is the sharper problem.
Where should you not trust AI with survey comments?
- Counting and percentages. Use a pivot table.
- Sarcasm and tone. "Great, another outage" can be read as positive. Check negative-sounding and positive-sounding mismatches against the score. A 2 with a "positive" tag deserves a look.
- Short or empty comments. "Fine," "ok," "n/a." Do not let the AI infer a reason. Mark them unclassified.
- Several issues in one comment. One tag loses information. Use primary and secondary themes, or allow multiple tags.
- Non-English comments. AI usually handles major languages reasonably, but spot-check each language separately, and have a native speaker review a sample if the stakes are high.
- Causes. A theme tells you what customers talk about. It does not prove that fixing it will raise the score. Treat it as a strong lead and test it.
- Who is missing. Only some customers answer surveys, and fewer leave comments. The themes describe commenters, not your whole base. Say so in the readout.
- Sensitive data. Customer comments can contain personal details, health information or complaints about named employees. Strip and route these according to your company's policy.
How often should you run this, and how do you keep it consistent?
Run it on the same schedule as your survey, usually monthly or quarterly. A few habits keep results comparable:
- Reuse the same codebook. Add themes only when needed, and note the date you added them. If you change definitions, retag the previous period so the trend is not an artifact.
- Keep a log. Record the date, the AI tool and model you used, the prompt versions, and your spot-check agreement rate.
- Track new and fading themes. A theme that goes from 1% to 6% in a quarter is often more urgent than the largest stable one.
- Close the loop. Send individual detractor comments that need a reply to the account owner or support, with the response ID. Aggregate analysis is for patterns, not for ignoring the person who asked for help.
Can you build your own survey comment dashboard?
If you repeat this analysis every quarter, the copying and pasting gets old. One option is a small internal tool: comments come in by upload or email, AI tags them against your saved theme list, and a dashboard shows themes by score band, segment and month, with the original comment always one click away. Remy builds this kind of app from a plain-English description, including the database, sign-in and a live URL, and you can choose which AI models it uses. You would still do the same spot-checks, so describe that review step in your request. Teams with stricter data rules should ask about data residency and access controls before putting customer comments in any new tool.
Frequently Asked Questions
How many comments do I need before AI analysis is worth it?
Around 100 comments is where reading by hand starts to feel slow and patchy. Below that, read them yourself. Above a few hundred, AI tagging saves real time, and above a thousand it is the only realistic way to cover everything.
Can ChatGPT or Claude analyze NPS comments directly from a spreadsheet?
Yes, many general AI assistants accept pasted text or uploaded files and can tag comments. Results are better in batches of 100 to 200 with a fixed theme list than with one giant file and an open-ended request. Always check your company's rules on uploading customer data first, and do the counting in your own spreadsheet.
What is the difference between analyzing NPS and CSAT comments?
The method is the same. The difference is context. NPS comments are about the overall relationship, so themes include pricing, product and brand. CSAT comments usually refer to one interaction, such as a support ticket or a delivery, so themes are narrower, such as agent knowledge or resolution time. Keep separate theme lists for each survey.
Is sentiment analysis enough?
Not on its own. Knowing 30% of comments are negative does not tell you what to fix. Sentiment per theme (for example, negative about support speed, positive about onboarding) is what points to an action.
How do I know the AI tagged comments accurately?
Check a random sample of about 50 tags against the original comments and calculate how often you agree. Around 85 to 90% or higher is a reasonable bar for internal reporting. If you fall short, tighten the theme definitions, add examples, and rerun the batches that went wrong.
Topics
How we source, write, and correct our articles. Editorial standards
Related articles

How Does Alex Hormozi's Team Use AI in Support and Sales?

Are managed database services worth it for small teams?
AI Skills to Learn in 2026 (Including for Marketers)